How do I open Event Viewer?
Press Windows + R, type eventvwr.msc and press Enter. Right-clicking the Start button and choosing Event Viewer works too, as does searching the Start menu for it. All three open the same console, and none of them require administrator rights.
The window is split three ways: the log tree on the left, the events in the middle, and the Actions pane on the right. Everything useful in this guide happens in the left and right panes; the middle one is the part that looks intimidating and is actually just a table.
Where are the errors that matter?
Expand Windows Logs in the left pane. For a misbehaving PC there are only two entries worth your attention: System for anything about hardware, drivers, disks, power and restarts, and Application for programs that crashed.
| Log | What it records | Worth opening when |
|---|---|---|
| System | Drivers, services, disks, network, power, the kernel itself | The PC restarted, froze, or a device stopped working |
| Application | Crashes and errors reported by installed programs | One specific program keeps closing or failing |
| Security | Logon attempts and audit records | You are investigating access, not malfunction (administrator only) |
| Setup | Windows installation and update servicing | An update failed to install |
| Forwarded Events | Events collected from other machines | Almost never, on a home PC — it is normally empty |
Applications and Services Logs
The other branch of the tree holds per-component logs, hundreds of them, and it is where the genuinely obscure detail lives — printing, Windows Update, PowerShell, individual vendors. Useful when you already know what you are chasing, overwhelming when you do not.
What do the columns mean?
Five columns carry all the meaning: Level, Date and Time, Source, Event ID and Task Category. The two that identify an event uniquely are Source and Event ID — that pair is what you search the web for, never the message text alone.
| Column | What it tells you |
|---|---|
| Level | How Windows classified the event: Critical, Error, Warning, Information or Verbose. It is a classification, not a severity ranking for you. |
| Date and Time | When it was logged. The single most useful column, because it lets you line events up against the moment something broke. |
| Source | The component that logged it, such as Kernel-Power or Service Control Manager. Event Viewer often shows a shortened name here. |
| Event ID | The number that identifies this specific kind of event within that source. Only unique together with the source. |
| Task Category | An optional sub-grouping the source may set. Frequently blank, and safe to ignore. |
Click an event and the General tab shows the message; the Details tab shows the raw XML behind it, which is where the extra fields live — a bug-check code, a device name, a process ID. When a message says almost nothing, the XML often says more.
How do I cut thousands of events down to a few?
Select a log, then click Filter Current Log… in the Actions pane on the right. Set the time range, tick Critical and Error, and a list of thousands becomes a list of dozens.
Filter by time first
The
Loggeddropdown takes Last hour, Last 12 hours, Last 24 hours, Last 7 days, or a custom range. If you know roughly when the problem happened, this cut alone removes most of the noise.Then by level
Tick
CriticalandError. Leave Warning off for a first pass — warnings are where the false alarms live.Narrow by source or Event ID if you already have a lead
The
Event sourcesdropdown lists every provider that has actually written to this log, and theIncludes/Excludes Event IDsbox accepts numbers and ranges —41,1001,6008is a perfectly good filter.Save it as a Custom View if you will do this again
Create Custom View…takes the same dialog and saves the result in the tree, so tomorrow’s check is one click instead of six. This is the single most underused feature in Event Viewer.
Two more things hiding in the right-click menu
Attach Task To This Event… creates a scheduled task that fires whenever that event is logged again — useful for catching an intermittent fault while you are away from the machine. Find… searches the message text of the current log, which the filter dialog cannot do.
How do I find the moment things went wrong?
Work backwards from the time, not forwards from the list. Note when the problem happened, filter the System log to that window, and read every Critical and Error entry around it in order — the useful signal is almost always a cluster, not a single line.
A crash usually leaves a recognisable group: something failing repeatedly for a while, then a hard stop, then a boot. If the PC restarted on its own, the specific events to look for are covered in why does my PC restart by itself.
Two habits save a lot of time. Sort by Date and Time descending so the newest is at the top. And check whether an error you are worried about also appears every day for the last month — if it does, it is part of the machine’s normal background noise and not the thing that broke yesterday.
The faster way, in PowerShell
One command replaces the whole filter dialog: Get-WinEvent with a filter hash table. Level 1 is Critical and level 2 is Error, so this returns the serious entries from the System log for the last three days.
PowerShell
Get-WinEvent -FilterHashtable @{
  LogName   = 'System'
  Level     = 1,2
  StartTime = (Get-Date).AddDays(-3)
} | Select-Object TimeCreated, Id, ProviderName, Message | Format-List
It is faster than the console, it can be re-run in a second, and the output pastes cleanly into a forum post. Reading the Security log this way needs an elevated PowerShell window; System and Application do not.
How do I export a log to send to someone?
Right-click the log in the left pane and choose Save All Events As…. If a filter is active the menu instead offers Save Filtered Log File As…, which is the one you want — it exports only the entries you narrowed down to.
.evtxkeeps everything and reopens as a real log in anyone’s Event Viewer. When Windows asks about display information, include it — otherwise the recipient may see events with no readable description..csvis right for spreadsheets and for pasting into a support ticket. It flattens the detail, but it is readable anywhere.- For a single event, the
Copy→Copy Details as Textmenu item gives you one tidy block including the Source, Event ID and full description — usually all a forum needs.
The 30-second version: Reliability Monitor
If all this feels like too much, press Windows + R and run perfmon /rel. Reliability Monitor shows a dated timeline of crashes, failed updates and hardware problems, and it is the fastest way to answer “when did this PC start behaving badly?”
It summarises rather than explains, so once you have the date you will usually come back to the event log for the detail — but starting from a known date makes that a two-minute job instead of an evening.
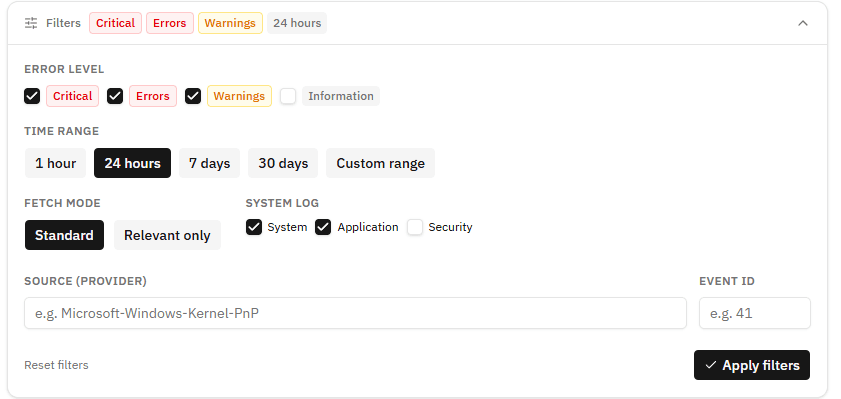
The same filters, without the dialog: ErrorAnalyser keeps level, time range, source and Event ID on screen while you work.